
Browse Run History
Run history lets you find and compare workflow executions across Builders. Use its scope controls and status filters to isolate a run, then open the run inspector to review timing, cost, and the block path that executed.
This article uses the Documentation - Run History pipeline in the Hack It UP - event project. Its controlled test runs include successful, failed, and long-running examples.
Choose the history scope
Open run history at the level that matches the question you are investigating:
| Scope | How to open it | Available context |
|---|---|---|
| Global | Open Runs without a project context. | Project selector, pipeline selector, and a Project column. |
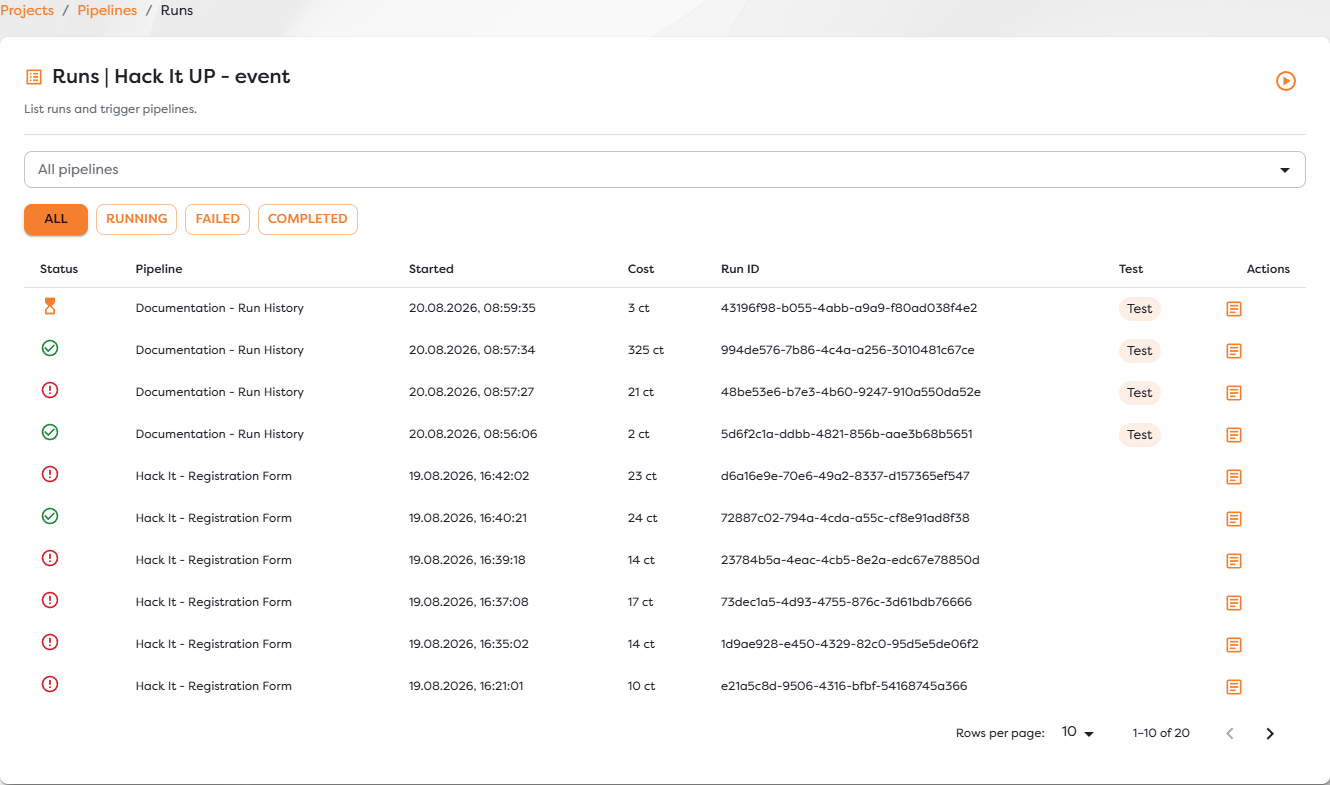
| Project | In Projects, choose Runs for a project. | Runs from that project, a pipeline selector, and no redundant project column. |
| Pipeline | Open Runs from a pipeline or its Designer. | Runs from the selected pipeline; the project and pipeline appear in the title. |
The global view is best for incidents that may span projects. Select a project first, then a pipeline, to narrow the list. Clearing the pipeline keeps the project filter; clearing the project returns to all projects and resets the dependent pipeline selection.
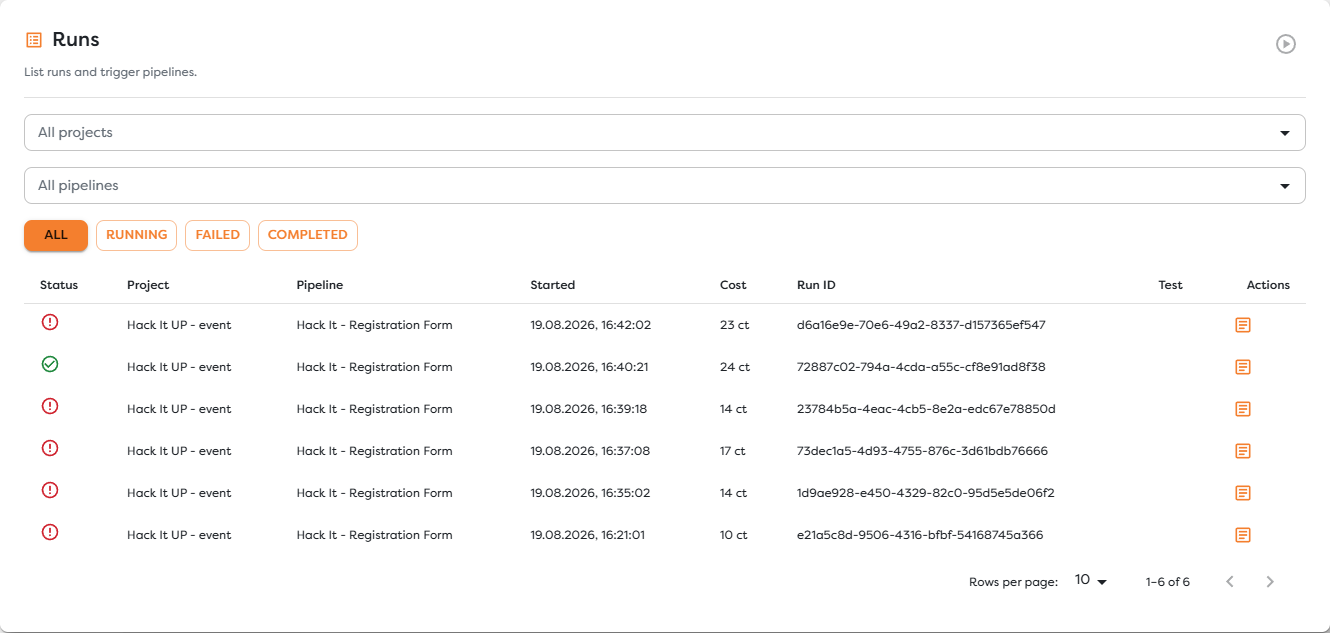
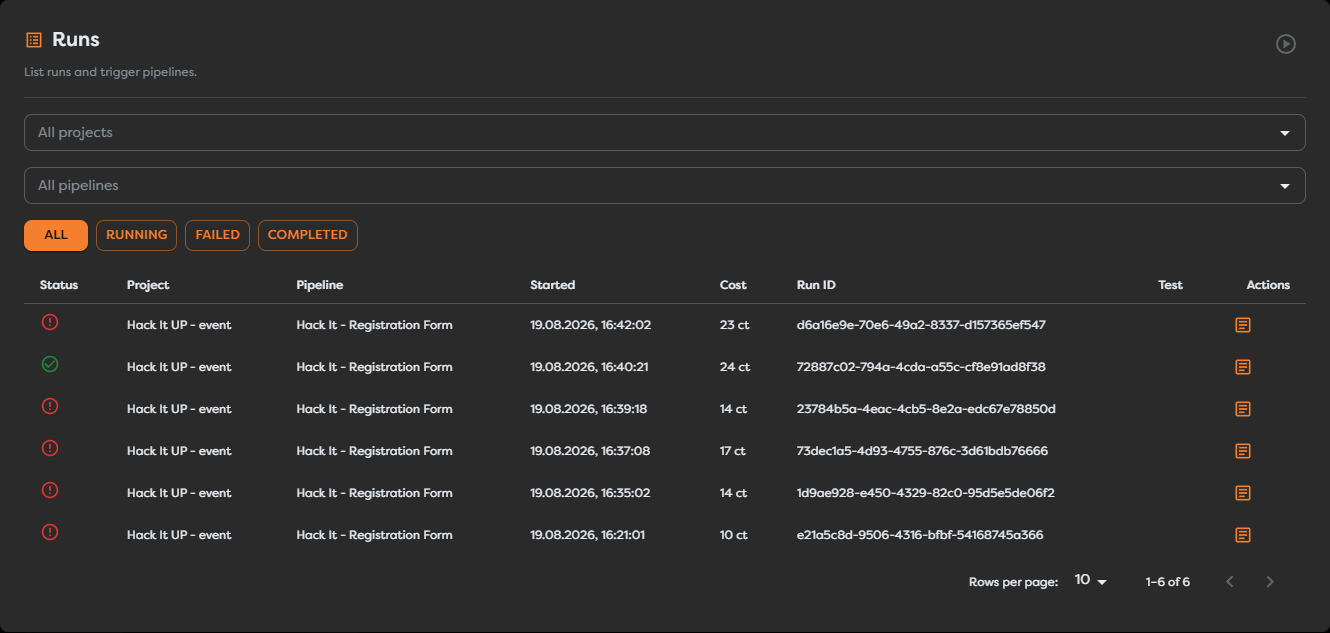
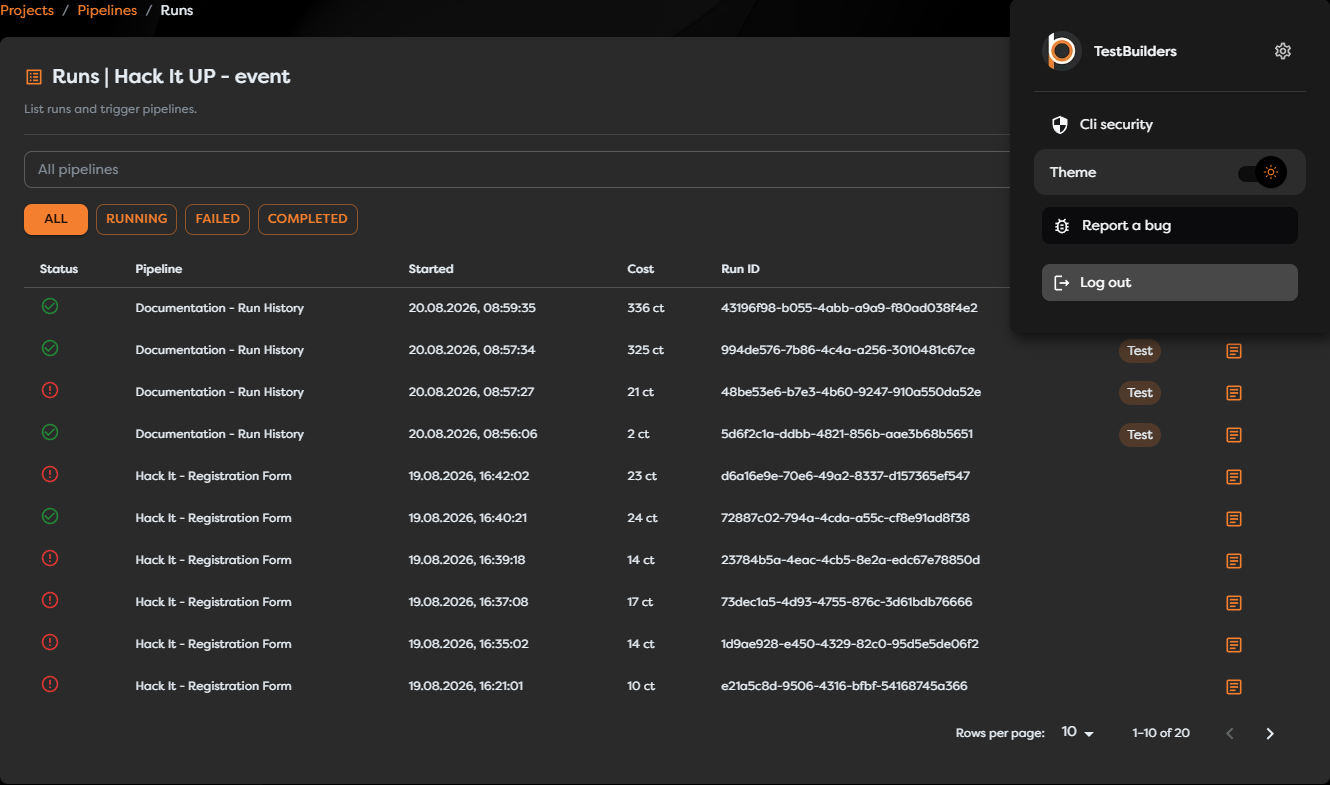
The project view keeps the same status controls while removing project information that is already established by the page context.
Filter by run status
The status buttons are mutually exclusive. Changing the status also returns the list to its first page.
| Filter | Runs shown |
|---|---|
| All | Running and terminal runs in the selected scope. |
| Running | Runs that have not reached a terminal state. |
| Failed | Runs that ended in fail or another failure outcome exposed by the history API. |
| Completed | Runs that finished successfully. |
Use Running when following current work or locating a workflow that appears stuck.
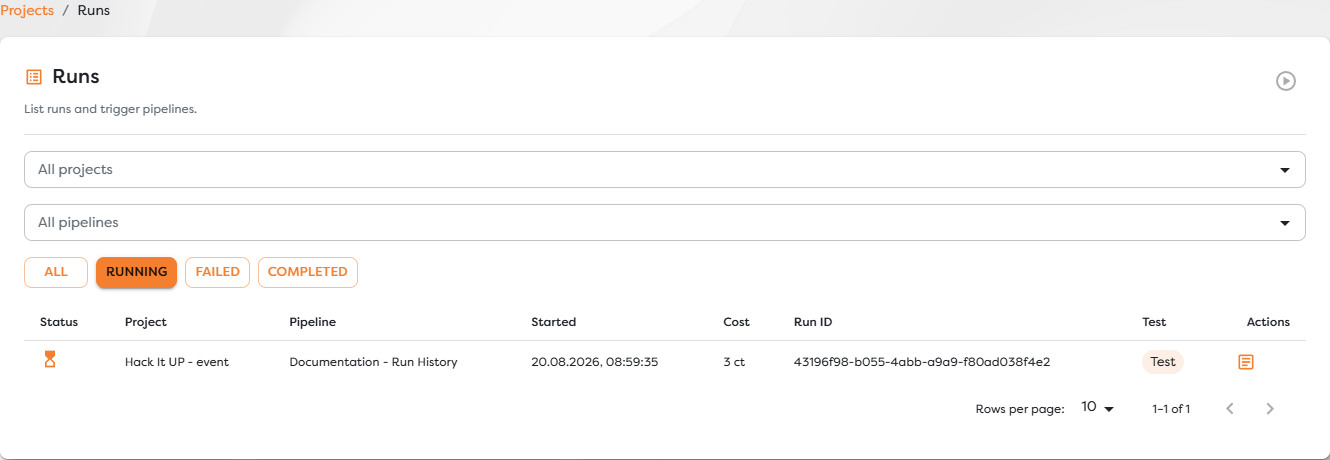
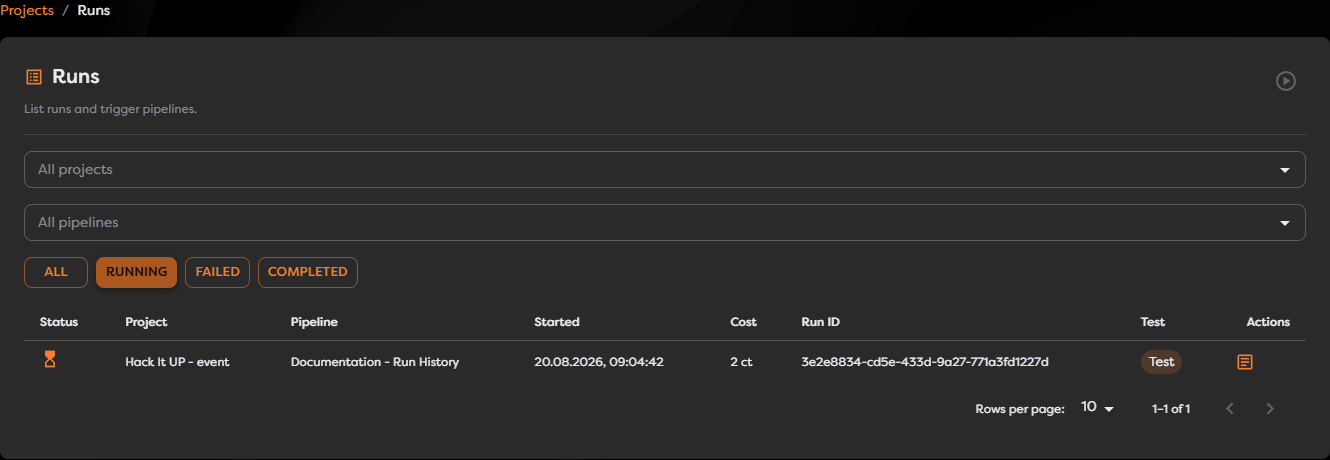
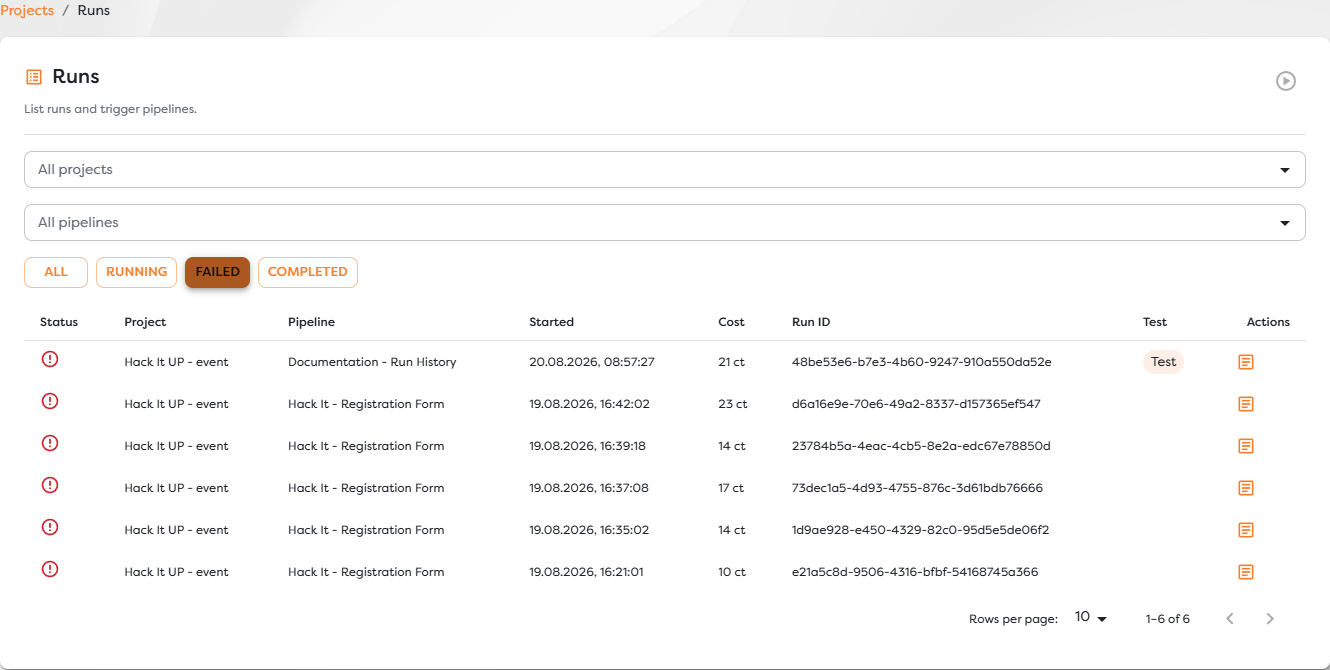
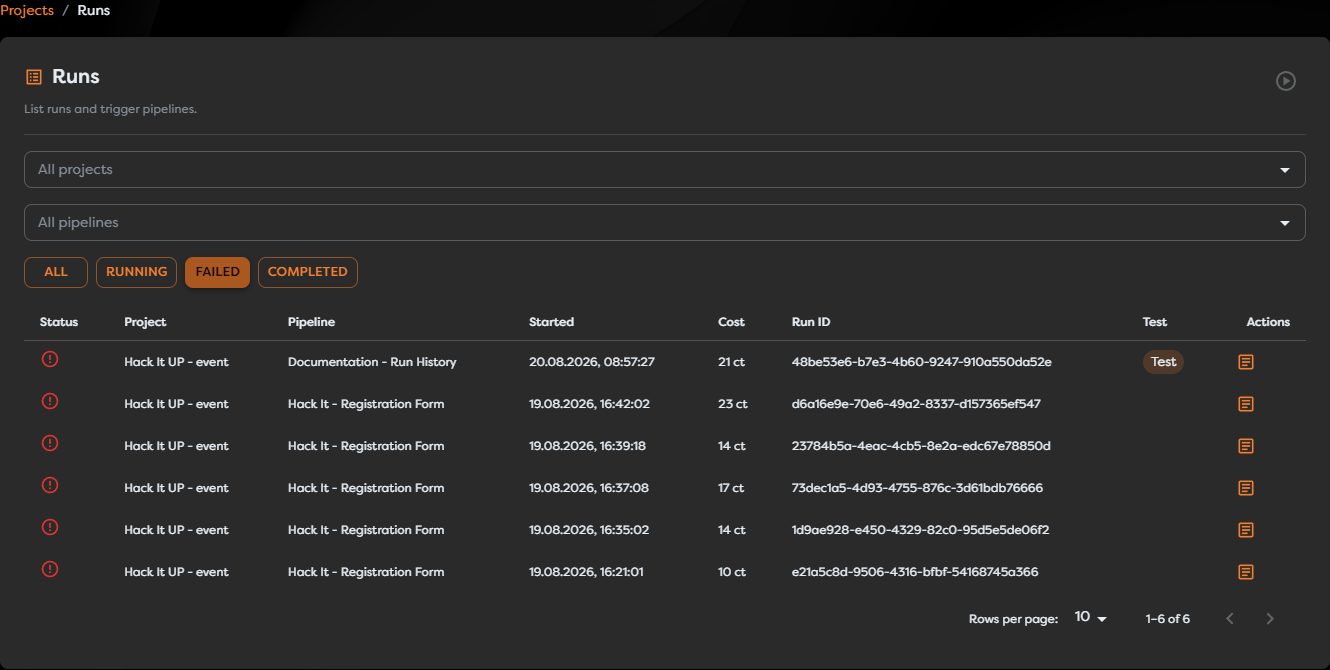
Use Failed to build a review queue. Start with the newest failure, but compare its project, pipeline, start time, and run ID before assuming that several rows represent the same incident.
A cancelled run has its own terminal status icon. If it is not present under Completed or Failed, return to All to locate it.
Read the run list
Each row summarizes one execution:
| Field | What to verify |
|---|---|
| Status | Whether the run is active, successful, failed, timed out, or cancelled. Hover the icon when you need its status label. |
| Project | The owning project in global history. This column is omitted in project-scoped history. |
| Pipeline | The workflow that accepted the trigger. |
| Started | The local date and time at which execution began. |
| Cost | Compute credits accumulated by the run. An active run can continue increasing this value. |
| Run ID | The unique UUID used to correlate the execution with trigger responses, logs, and external records. |
| Test | A marker for runs started in test context. An empty cell does not indicate success; it only means the run is not marked as a test. |
| Actions | The Logs action that opens the run inspector. |
The list does not show a separate finish time or duration column. Open the run inspector to read Finished. When duration is required, calculate the difference between Started and Finished; a dash for Finished means the run is still active.
Open run details
Choose Logs in the row's Actions column. The inspector header shows the pipeline and project, run UUID, start and finish times, overall status, and total cost. The execution list on the left shows the blocks that were reached, their individual states, block types, and costs.
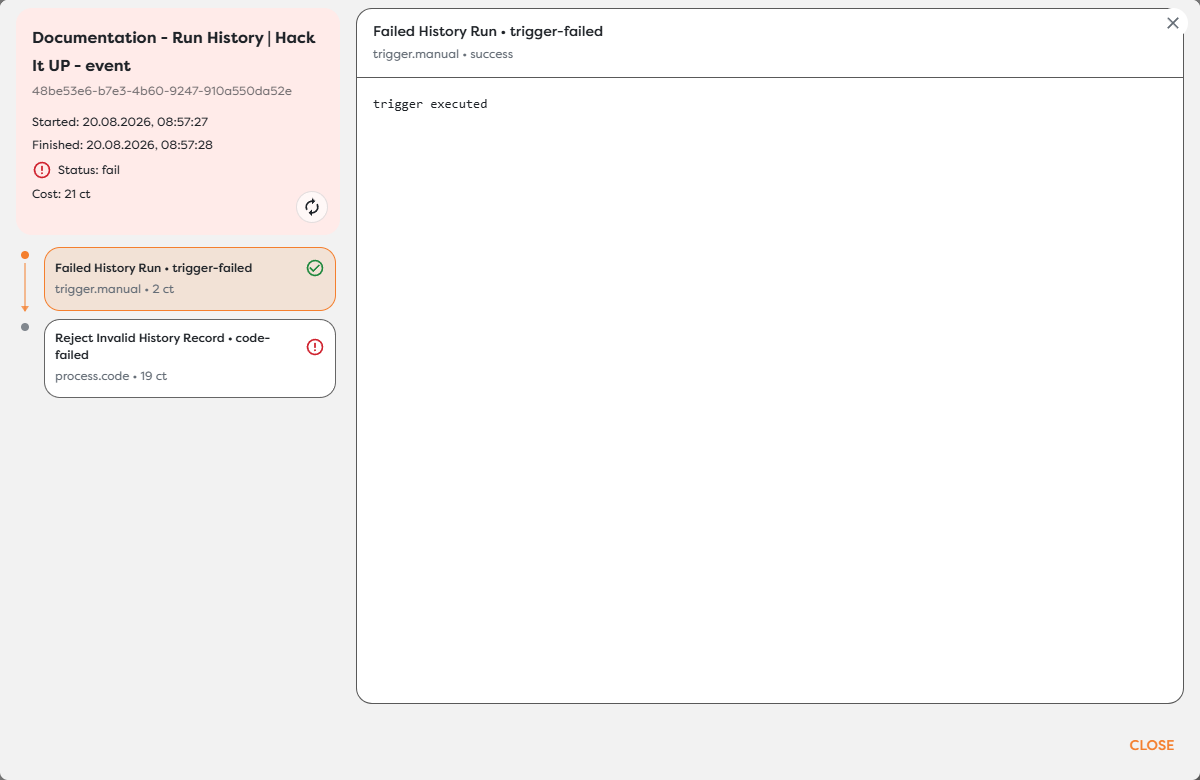
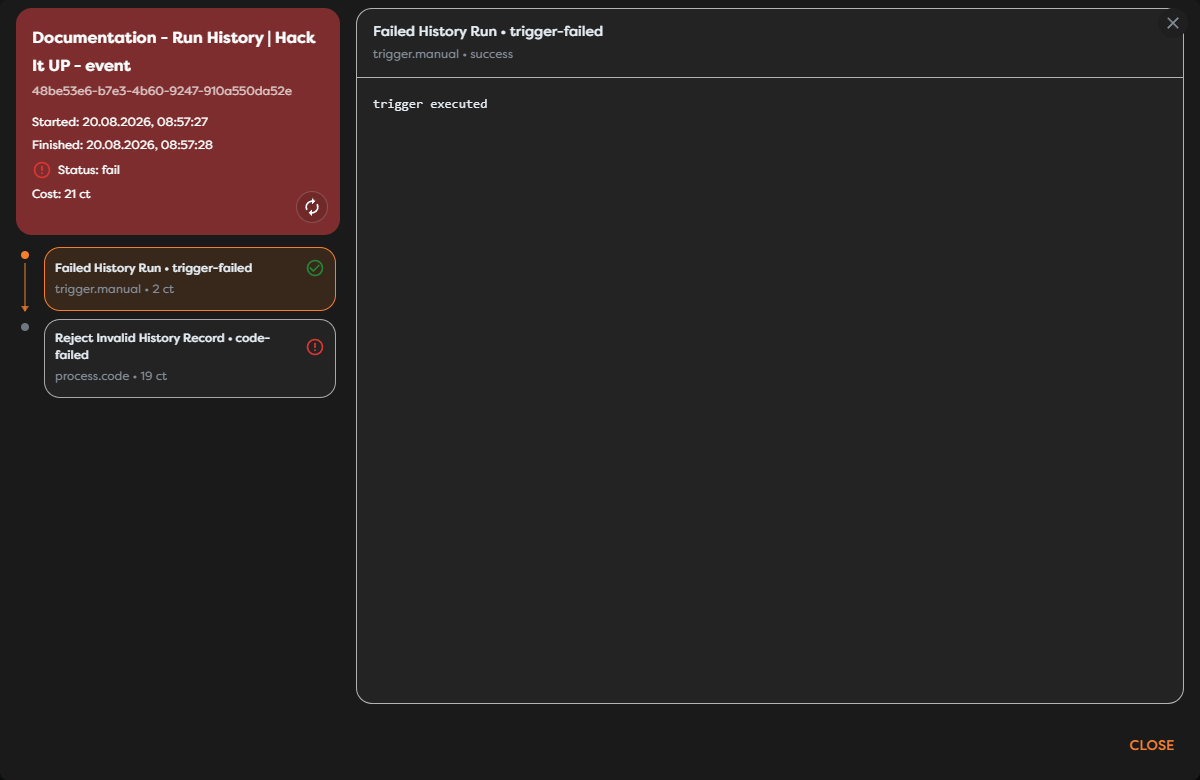
Use the inspector to answer these questions in order:
- Is this the correct run UUID, project, and pipeline?
- Did the run finish, and what terminal status did it reach?
- Which block is the first one that did not succeed?
- How much of the total cost belongs to that execution path?
- Do the selected block's messages explain the observed outcome?
Selecting a block changes the messages shown in the right panel. Detailed interpretation of logs and rendered output is covered in Read Block Logs and Output.
For a terminal run, the circular Renew action starts another run from the recorded pipeline version and preserves whether it was a test. Treat this as a real execution: it can repeat external side effects and consume more credits.
Understand automatic refresh
After the first list load, Builders refreshes visible run history automatically every 10 seconds. The refresh is silent, keeps the current project, pipeline, status, page, and page-size controls, and can update status or cost without replacing the whole screen with a loading state.
Automatic list polling pauses while either the run inspector or the Trigger run dialog is open. This prevents the table behind the dialog from changing while you work in it. An open inspector instead subscribes to events for its selected run, so its run status, block states, messages, finish time, and cost can continue changing in place.
After closing a dialog, list polling resumes. Allow one refresh cycle when the table still shows an older state, or reopen the relevant scope to request the list immediately.
Move through longer histories
Use Rows per page to show 10, 20, or 50 rows. The range beside it shows which slice of the current filtered result is visible. The previous and next arrows move between pages.
Filtering can reduce the number of rows and pages. Builders returns to the first page when you change the project, pipeline, status, or rows per page, which prevents an empty later page from hiding matching runs.
For repeatable investigations:
- Select the narrowest useful project and pipeline scope.
- Choose the relevant status.
- Set a page size that supports scanning without losing row context.
- Match the exact run ID rather than relying only on time or status.
- Open Logs and record the first unexpected block execution.
Troubleshoot history results
- A new run is missing: verify the current project, pipeline, and status filters, then wait for the next automatic refresh. Use All when the run may have completed before you opened the page.
- The list did not update behind the inspector: list polling is paused while a dialog is open. The selected run can still update inside the inspector; close it to resume table refresh.
- A cancelled run is absent from Completed: use All and identify the cancelled status icon.
- The cost changed after the first observation: an active run accumulates cost as blocks execute. Use the terminal inspector value for the final total.
- Several runs look identical: compare their complete UUIDs and test markers. Start time, pipeline name, or block label alone is not a unique identifier.
- The finish time is empty: the run has not reported a terminal result. Check its active block and allow the inspector to receive further progress events.