
Read Block Logs and Output
The run inspector shows which blocks executed, what each execution reported, and how much it contributed to the run's cost. Use it to follow data through a workflow, locate the first unexpected result, and collect evidence without exposing sensitive values.
This article uses the Documentation - Block Logs pipeline in the Hack It UP - event project. Its controlled run produces a structured registration summary and a final JSON preview.
Open the run inspector
Open Runs globally, from a project, or from a pipeline. Locate the exact run, compare its UUID with the trigger response or external record, and choose Logs.
The summary at the top of the inspector identifies the run and shows:
- the pipeline and project;
- the run UUID;
- start and finish times;
- the overall status;
- the total cost in compute credits.
The execution path on the left contains one card for every block execution that reached the run record. Each card shows the configured block label, workflow block ID, block type, status, and individual cost. Select a card to open its runtime details on the right.
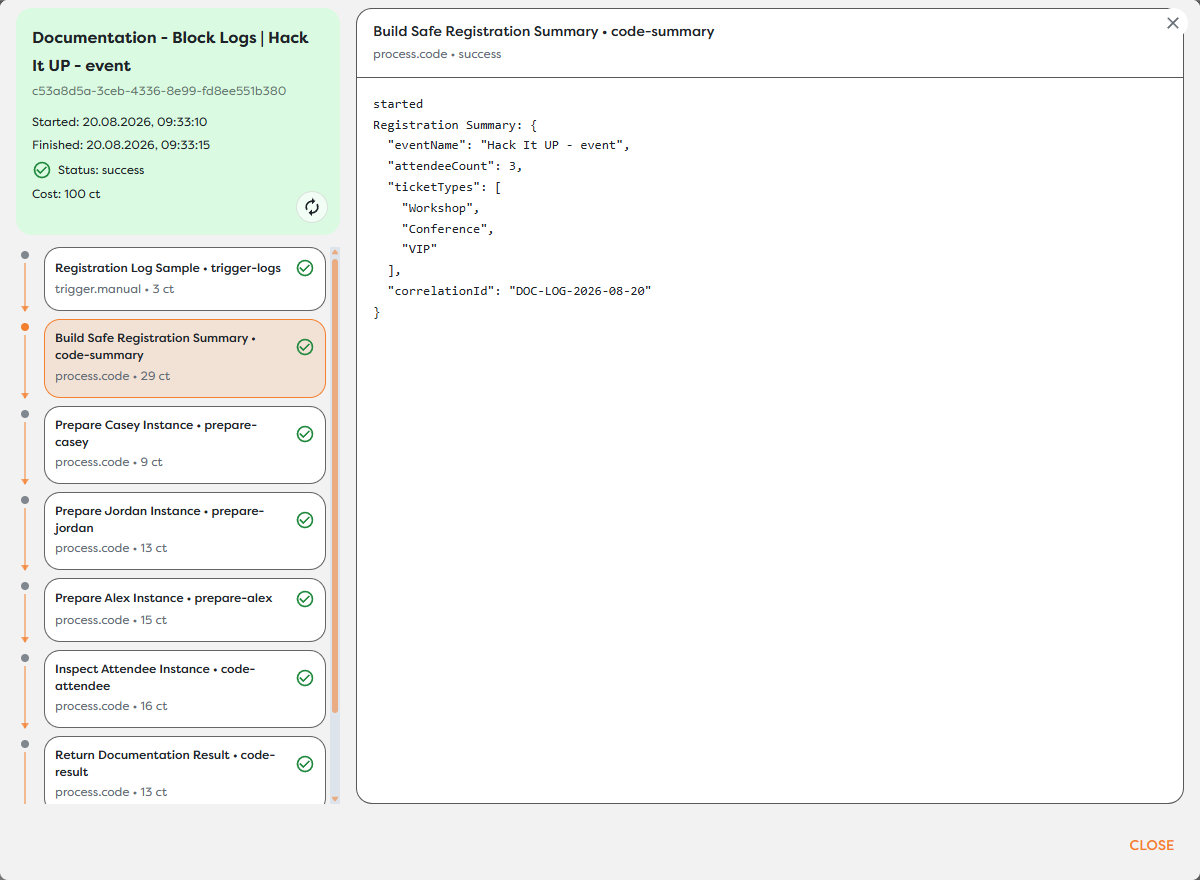
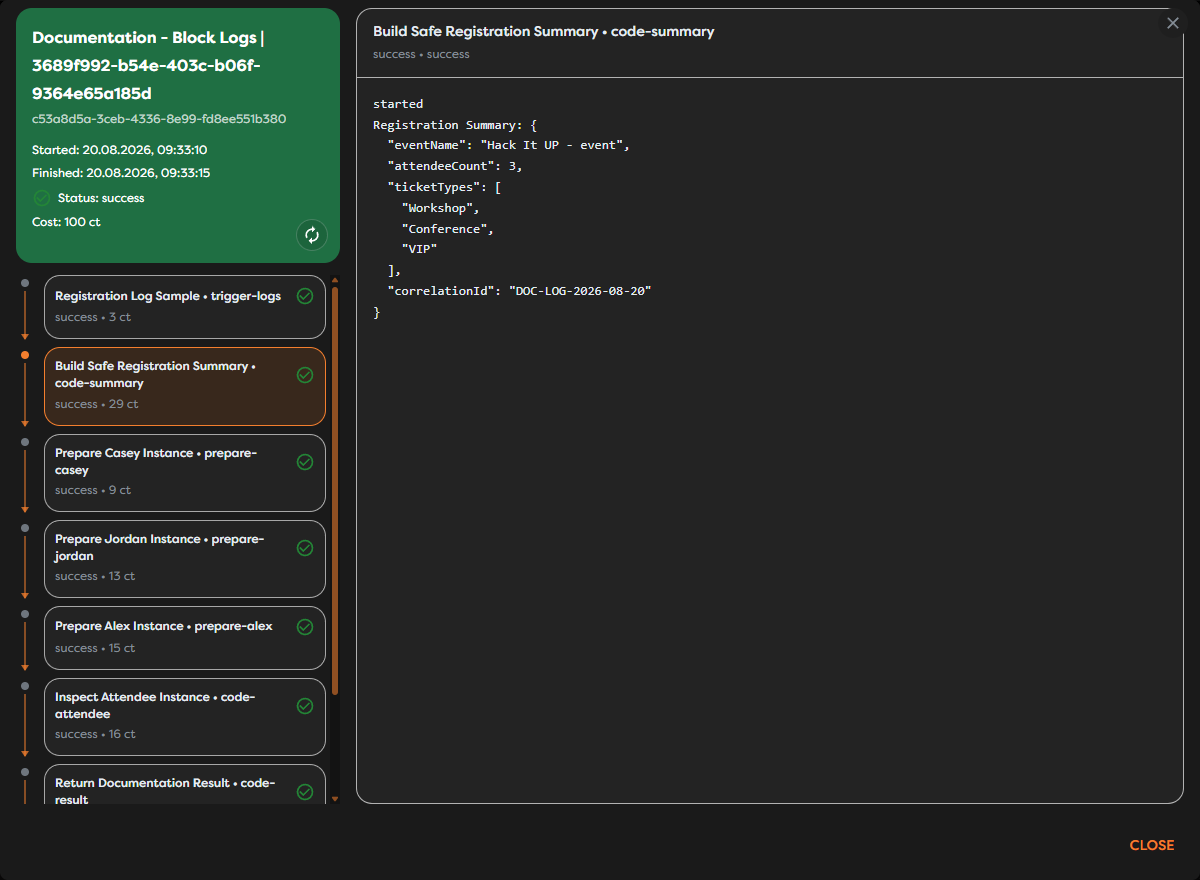
Confirm the run UUID before reading individual blocks. Similar runs can use the same pipeline, block labels, and input while representing separate executions.
Identify the relevant block execution
Read the execution path from top to bottom and stop at the first block whose state or messages differ from what you expected. A downstream failure can be a consequence of an earlier block returning incomplete data.
Use these identifiers together:
| Identifier | What it tells you |
|---|---|
| Run UUID | Which complete workflow execution you are inspecting. |
| Block label | The human-readable purpose configured in the Designer. Labels do not have to be unique. |
| Workflow block ID | Which node in the saved workflow produced the execution. |
| Position in the execution list | Which occurrence and path segment you are reading. |
| Status and cost | Whether that occurrence completed and how many compute credits it used. |
Do not identify a production incident from a label alone. Keep the run UUID with any copied log excerpt or support note.
Distinguish repeated executions
The same workflow block can appear more than once when an execution path re-enters or repeats that node. This can occur in workflows or runtime paths that support iteration, retry, or repeated subflow behavior. The cards can look duplicated because they share the same label and workflow block ID, but each card represents a separate execution instance.
When reading repeated entries:
- Keep the run UUID fixed so you do not mix occurrences from different runs.
- Follow the cards in execution order.
- Compare each occurrence's status, cost, and messages.
- Use a safe iteration key, item ID, or correlation ID in diagnostic logs when the occurrences otherwise look identical.
Builders does not currently provide a separate Loop or For Each block in the standard block picker. Do not infer that two identical-looking cards are duplicate UI rows; treat each returned execution entry as its own occurrence.
Read runtime logs
After selecting a block, the right panel shows messages recorded for that execution. Code blocks can write diagnostic information explicitly, while system blocks can report lifecycle, validation, or provider messages.
For readable structured logs, serialize a small diagnostic object with indentation:
const summary = {
eventName,
attendeeCount: attendees.length,
ticketTypes,
correlationId
};
ctx.log("Registration Summary:", JSON.stringify(summary, null, 2));
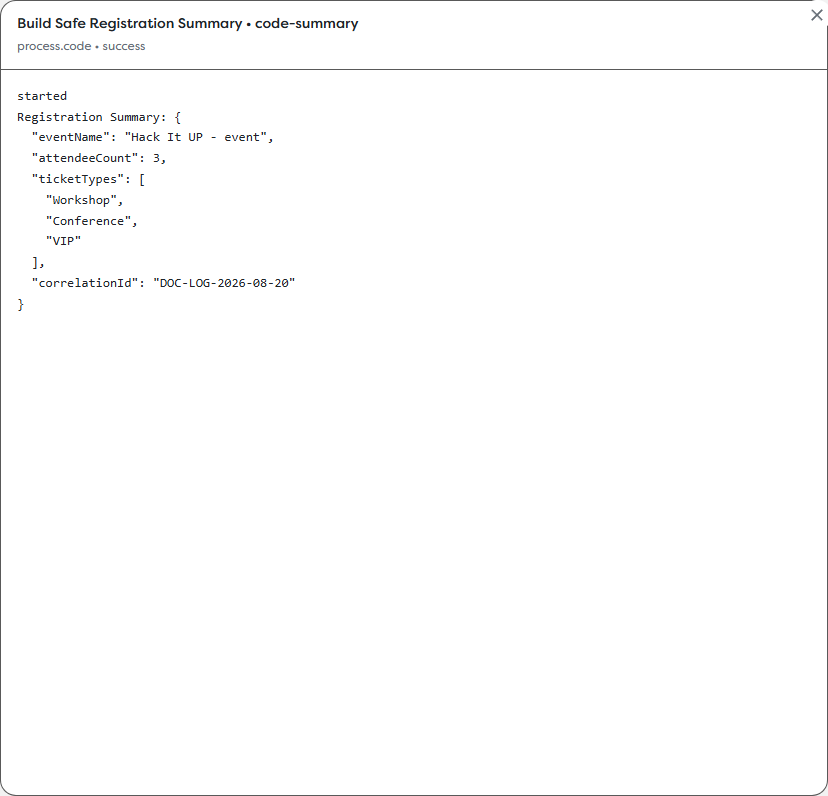
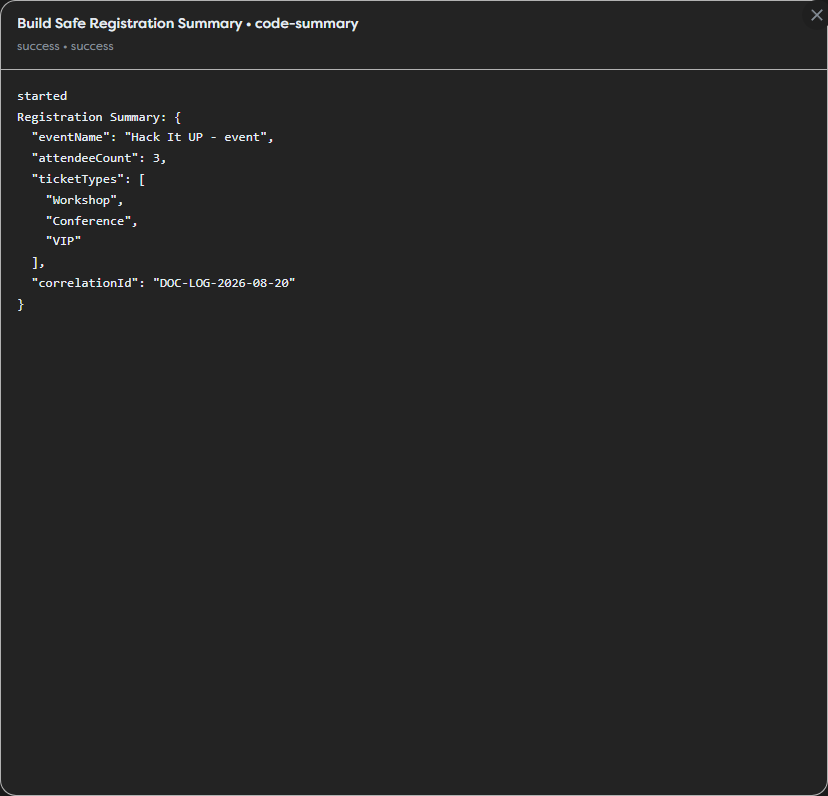
An object log whose complete message is valid JSON beginning with { and ending with } is automatically parsed and formatted by the inspector. A prefixed message is displayed as written, so use JSON.stringify(value, null, 2) when you want the JSON portion to remain indented. Arrays are not automatically formatted by the object-only formatter.
Prefer compact diagnostic objects over complete payload dumps. Include stable context such as a correlation ID, operation name, item count, and non-sensitive status.
Determine block input and output
The current inspector does not expose universal Input and Output tabs for every block type. What appears in the detail panel depends on the selected block and the runtime data it reports.
To determine what a block received:
- Inspect the preceding successful block and its diagnostic output.
- Compare the configured template expressions with the upstream data shape.
- Add a temporary, explicitly redacted diagnostic log when the received shape is still unclear.
- Run the workflow again with controlled input, then remove unnecessary diagnostics.
To determine what a block returned, inspect its messages or a downstream block that consumes the value. For data intended for human inspection, a Render block provides a dedicated preview. Supported render kinds include text, JSON, XML, HTML, image, and PDF. The preview identifies the render kind and MIME type; valid JSON is displayed in an indented form.
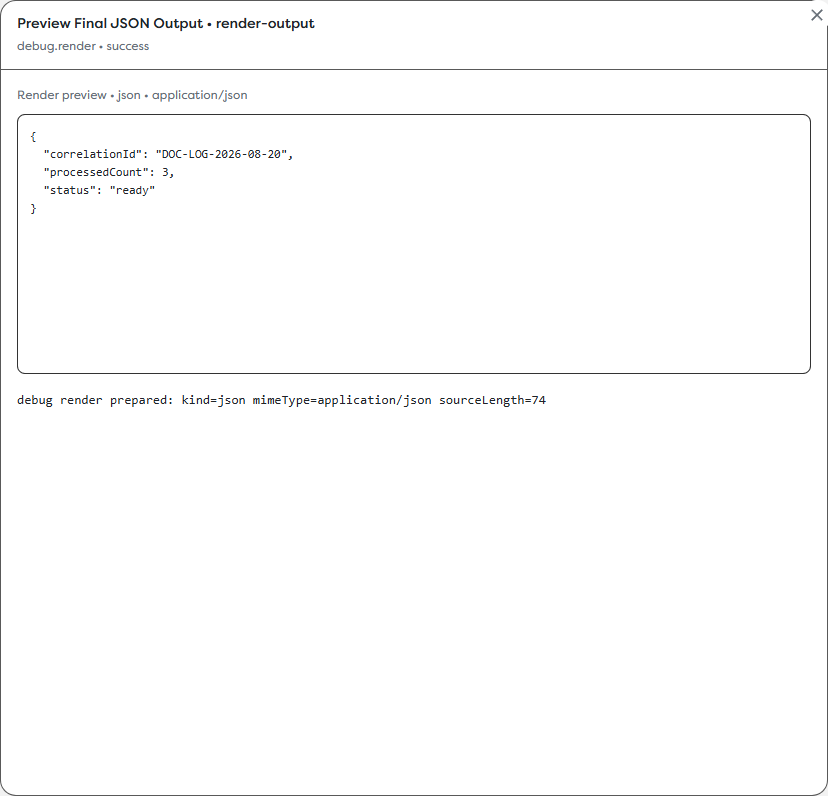
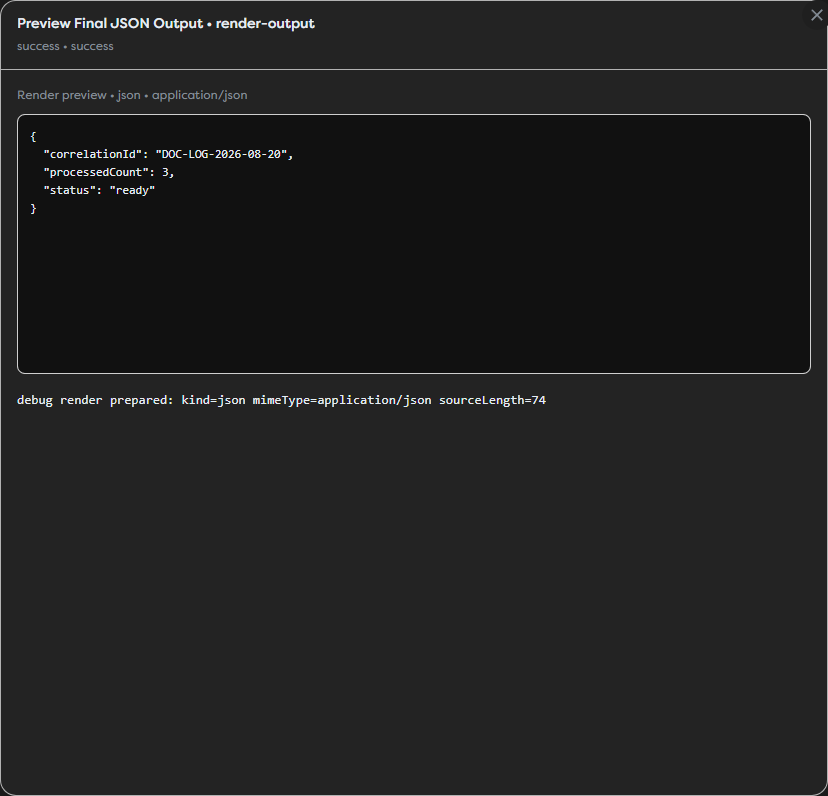
A render preview is part of the run record, not a replacement for an application response contract. Verify the actual consuming integration or published trigger response separately when that boundary matters.
Interpret timing and cost
The run summary shows Started and Finished for the complete execution. Subtract them to estimate wall-clock duration. A missing finish time means the run has not reported a terminal state.
Costs appear at two levels:
- the run header shows the total accumulated cost;
- each execution card shows the cost attributed to that block occurrence.
Cost is not duration. A high-cost block is not necessarily the slowest one, and several low-cost executions can together account for most of a run. Wait for a terminal state before recording final cost because an active run can continue accumulating credits.
Protect sensitive data
Run logs and render previews are retained with execution details and can be read by team members who have access to the run. Never write these values to logs or previews:
- passwords, access tokens, API keys, session cookies, or authorization headers;
- webhook signatures, private keys, or database connection strings;
- secure General Vault values after they have been resolved at runtime;
- complete personal records when a count, internal ID, or masked value is sufficient.
Referencing a value through {{vault.key}} protects it from being stored directly in workflow configuration, but logging the resolved value exposes it in the run record. Redact before logging, for example by keeping only the final four characters, a one-way hash, a non-sensitive identifier, or an aggregate count.
When debugging a third-party request, record the provider operation, response status, correlation ID, and a sanitized error message. Do not record the complete request headers or body by default.
Troubleshoot missing or confusing details
- The right panel is empty: verify that the selected block emitted a runtime message or supported render output. Not every successful block produces visible logs.
- Input is not shown: inspect the upstream result or add a temporary redacted diagnostic log; there is no generic input tab for every block.
- JSON appears on one line: log a complete JSON object or serialize the value with two-space indentation before adding a text prefix.
- Several cards have the same name: compare the workflow block ID, list position, status, cost, and a safe item or correlation identifier.
- The final output is absent: select the block that creates the render result and confirm that its kind, MIME type, and source are valid.
- The run total changes while the dialog is open: the inspector can receive live execution updates. Record the result only after the run reaches a terminal status.