
Dashboard Overview
The Builders dashboard is the operational starting point for your workspace. It summarizes recent compute-token usage, available balances, storage, active pipelines, recent activity, and shortcuts to the areas used most often.
Open Dashboard from the application menu. The page is an overview, not a replacement for detailed run, budget, or log views.
Usage and capacity
The Usage panel combines a 30-day compute-token chart with the current capacity summary.
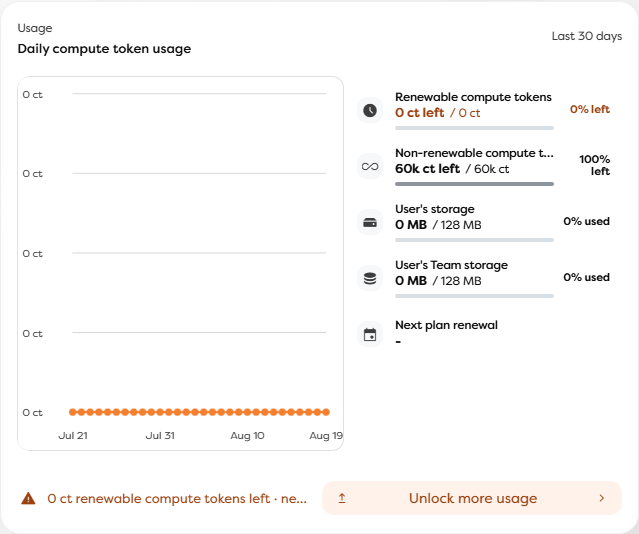
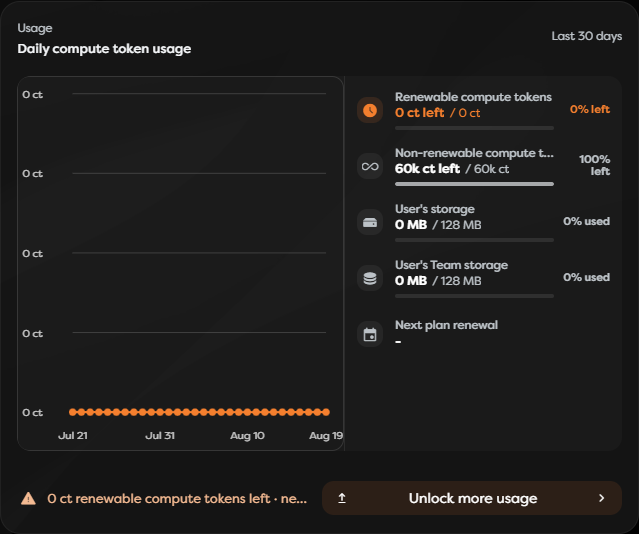
The chart shows daily compute-token spending for the last 30 days. A flat line at 0 ct means no compute tokens were recorded for those dates; it does not indicate whether pipelines, integrations, or stored resources exist.
The summary distinguishes several values:
- Renewable compute tokens show the remaining balance from an active renewable package.
- Non-renewable compute tokens show the remaining balance from one-time or add-on capacity.
- User's storage shows personal persistent storage use and its limit.
- User's Team storage shows the applicable team storage use and limit.
- Next plan renewal shows the next renewal date when an active renewable package provides one. A dash means no renewal date is currently available.
Percentages describe the corresponding balance or storage line, not the entire account. For example, 0% left on renewable tokens can appear while non-renewable tokens are still available. Review both balances and open Budget before concluding that a workflow cannot run.
A warning at the bottom highlights relevant capacity risks. Unlock more usage opens the available upgrade or add-on options; it does not itself change the current package.
Workflow runs consume compute tokens from the personal or team owner of their project. Use the detailed Budget view when you need to confirm the exact owner balance, package lifecycle, or reason for a rejected run.
Last builder path
Last builder path provides links back through the most recently available Builder context:
- Project opens the relevant project.
- Pipeline opens its pipeline context.
- Version opens the workflow version when that context is available.
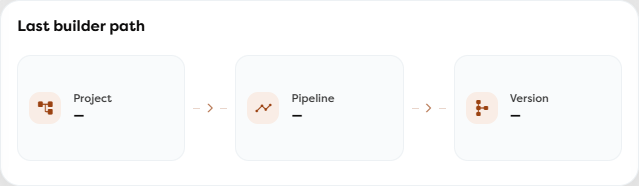
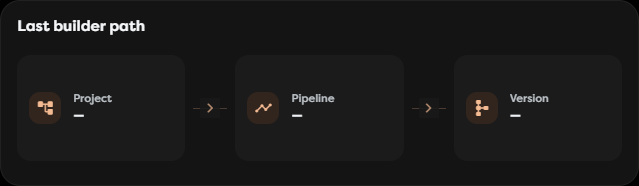
A dash means Builders does not currently have a value for that level. This is a normal empty state for a new account or when no resumable context is available. Use Projects from Quick access instead.
Quick access
The Quick access panel opens common product areas without using the application menu.
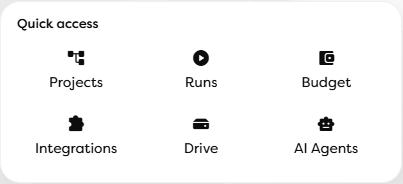
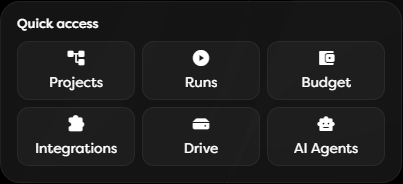
- Projects opens project and pipeline management.
- Runs opens global run history and its filters.
- Budget opens compute-token, AI-token, package, and renewal details.
- Integrations opens configured connections and the integration catalog.
- Drive opens persistent Static Drive storage.
- AI Agents opens private AI-provider connections.
These shortcuts do not bypass permissions. Team-owned resources and administrative actions remain limited by your team role and resource ownership.
Active pipelines
The Active pipelines panel lists workflows that are currently running. It updates through a live connection, so a running pipeline can appear or disappear without manually reloading the page.
Each active entry identifies the relevant workflow and provides access to its run context. View all opens the broader active-run view and includes the current active count.
When nothing is running, the panel displays No active pipelines and keeps Live refresh enabled. This empty state does not mean that saved or published pipelines are missing; it only means that no run is active at that moment.
Alerts and events
The activity panel has two tabs with different purposes:
- Alerts surfaces operational notifications, unread state, and links to affected workflows or nodes.
- Events records user activity such as creating or editing projects and configuring integrations.
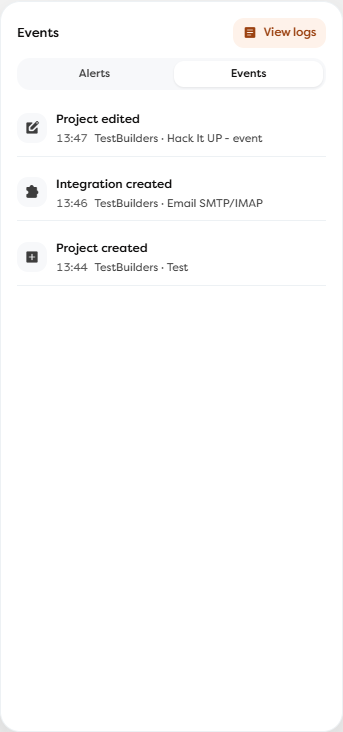
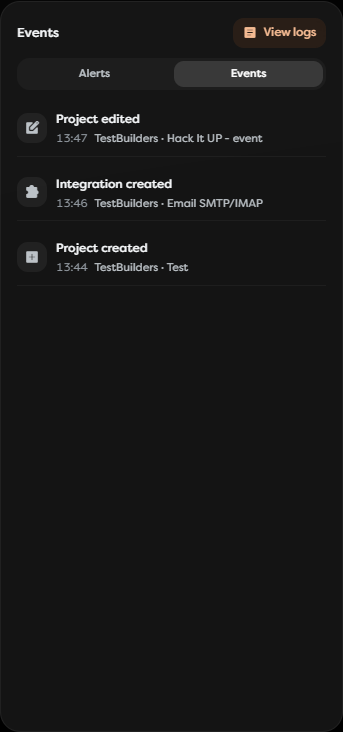
Event timestamps use the browser's local time. Each entry identifies the action, actor, and affected resource. Select View logs to open the full Logs area, where you can browse and filter the retained user-event history. User events are retained for 30 days.
Alerts can update while the dashboard is open. Use the notification bell to see the unread count and mark alerts as read. Opening an alert can take you directly to its project, pipeline, or node when that context is available.
How to use the dashboard
Use the dashboard for a quick health check:
- Check Active pipelines for work currently in progress.
- Review Alerts for failures or other operational issues.
- Check renewable and non-renewable compute-token balances before starting important runs.
- Review storage percentages before workflows upload or generate large files.
- Resume recent work through Last builder path, or use Quick access to open the detailed area you need.
Values on the dashboard are summaries. Use Runs for execution details, Logs for user activity, Budget for capacity, and project settings for ownership and permissions.