
Alerts and User Events
Builders exposes two activity streams with different purposes. Alerts report operational conditions that may require action, such as a failed run or a budget issue. Events record changes made by users to projects, pipelines, integrations, and General Vault entries.
Use alerts to investigate workflow health. Use user events to answer who changed a resource and when.
Watch the unread alert count
The notification bell in the application header shows the unread count. Open it to check active pipeline runs and use the Alerts action to open the complete alert list.
The dashboard also provides an Alerts tab. New alerts can appear there while the dashboard is open, without a manual page reload. An alert card identifies the project, pipeline, workflow version, run ID, creation time, and reported reason when that context is available.
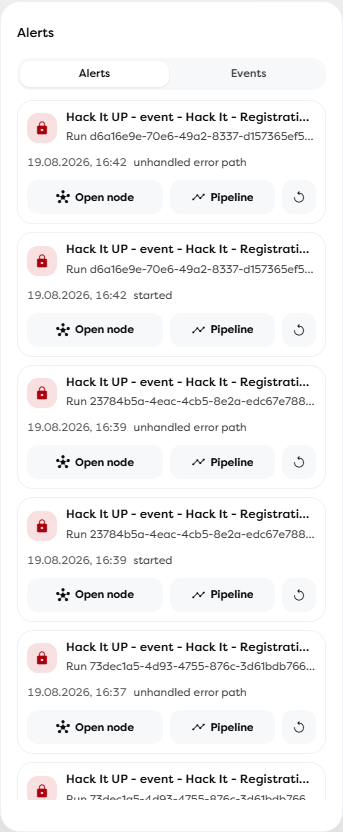
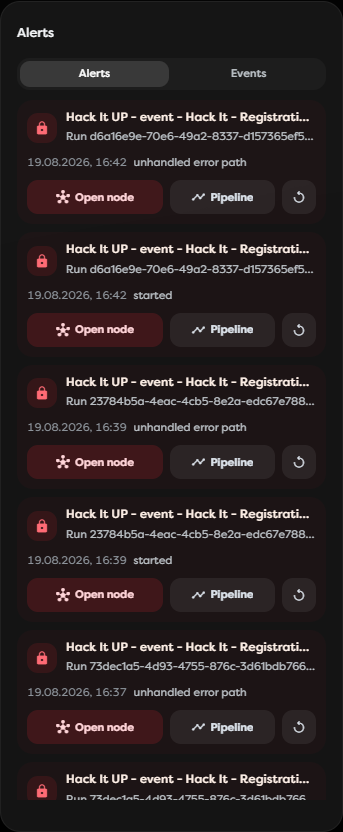
The card actions provide different investigation paths:
| Action | Result |
|---|---|
| Open node | Opens the affected workflow and focuses the blocking node when Builders recorded node context. |
| Pipeline | Opens the affected pipeline without requiring node context. |
| Re-run | Starts the failed run again from its recorded workflow version. |
Treat Re-run as a real execution. It can consume compute tokens and repeat external effects such as sending messages, writing records, or calling third-party APIs.
Browse the complete alert list
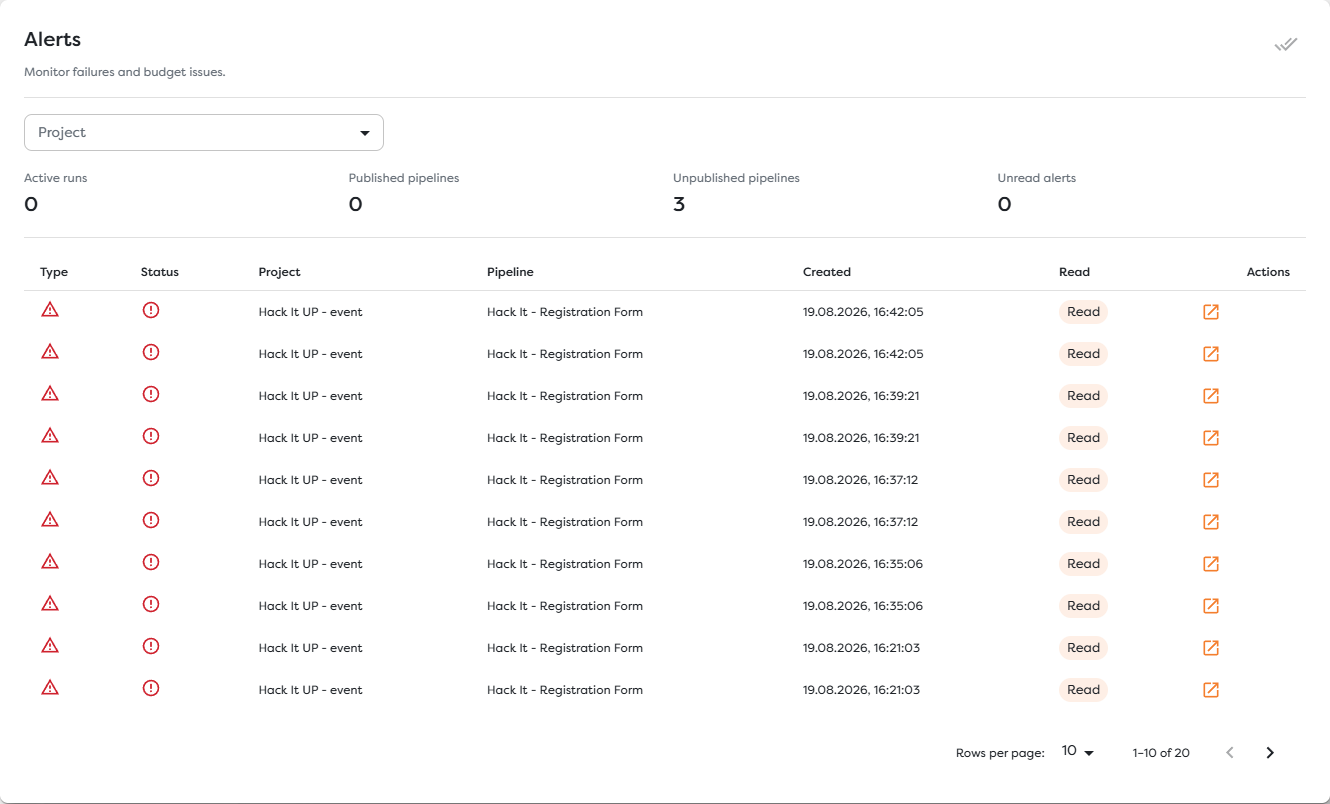
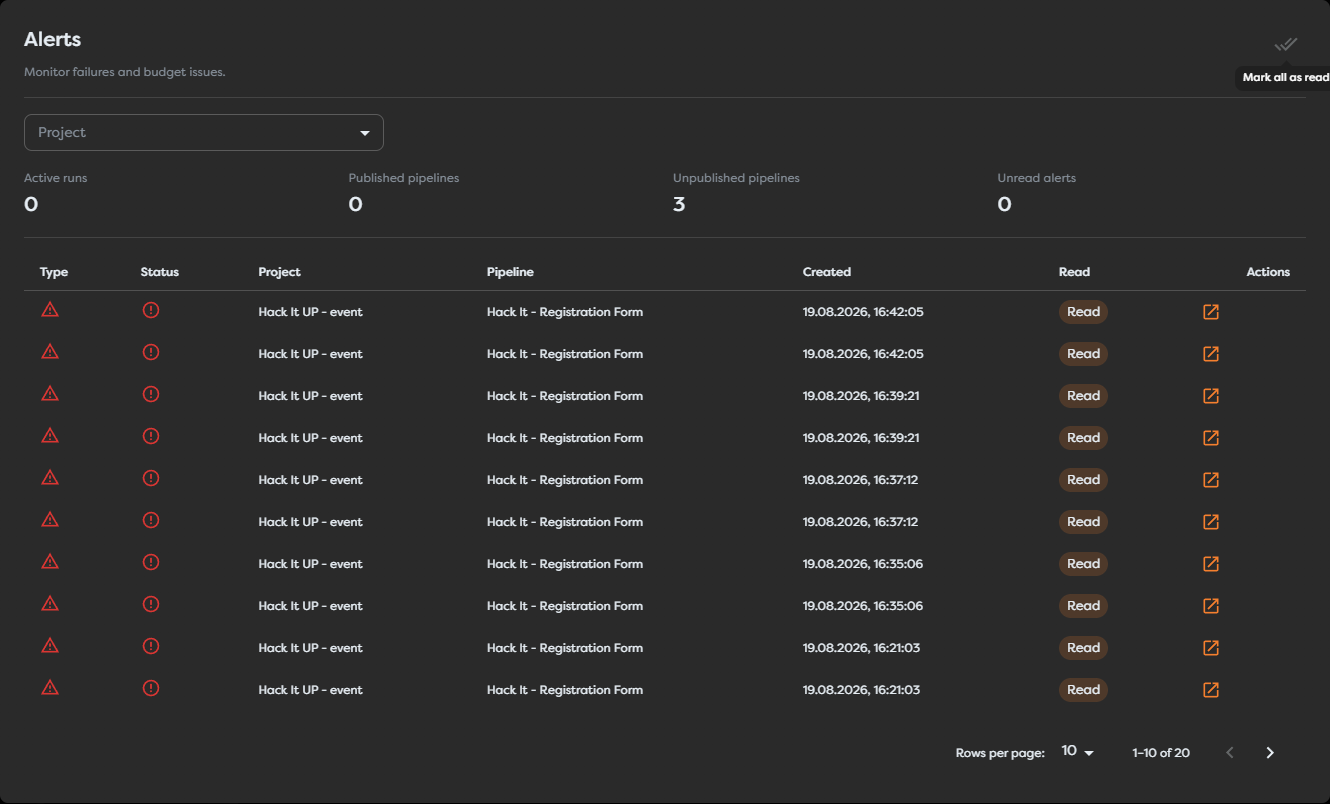
Open Alerts from the notification popover to review all retained alerts. The summary shows active runs, published and unpublished pipelines, and the number of unread alerts. Use the Project selector to restrict the summary and table to one project.
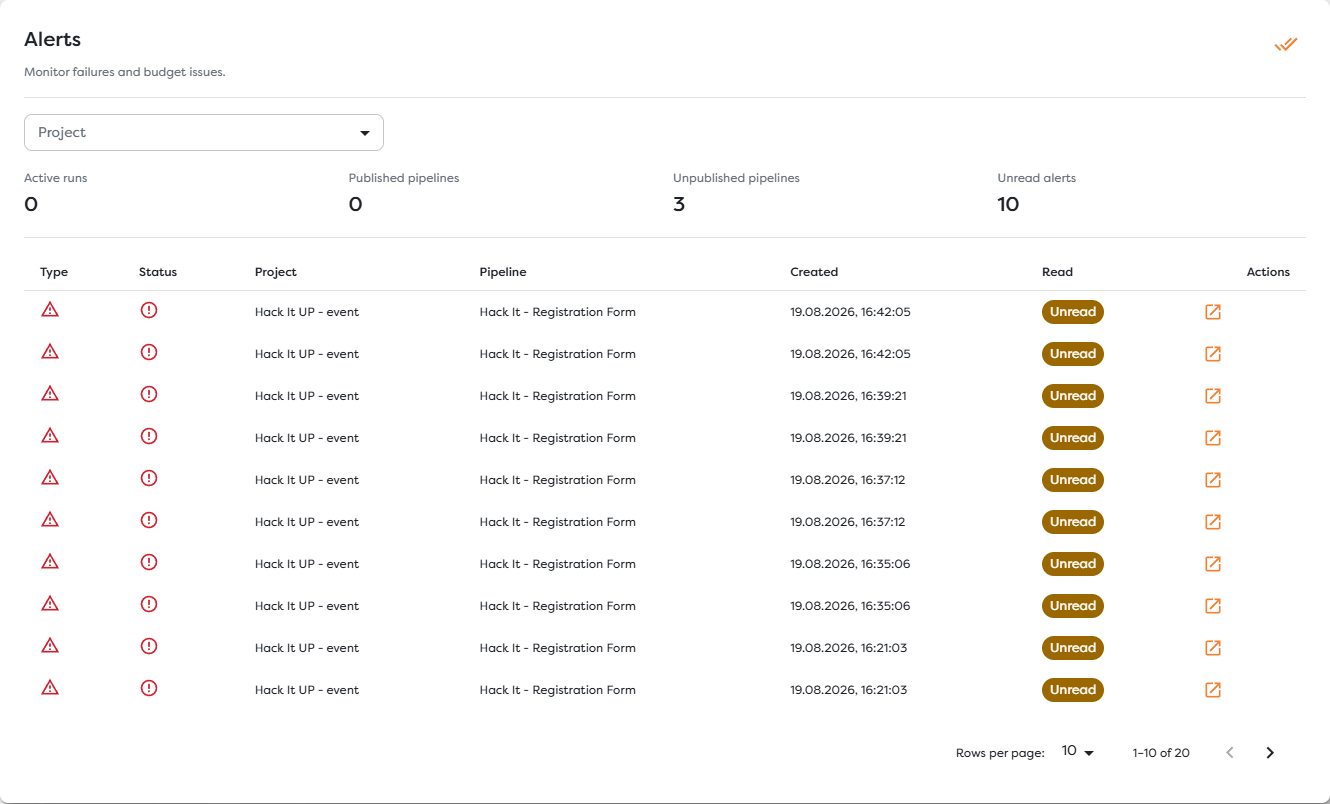
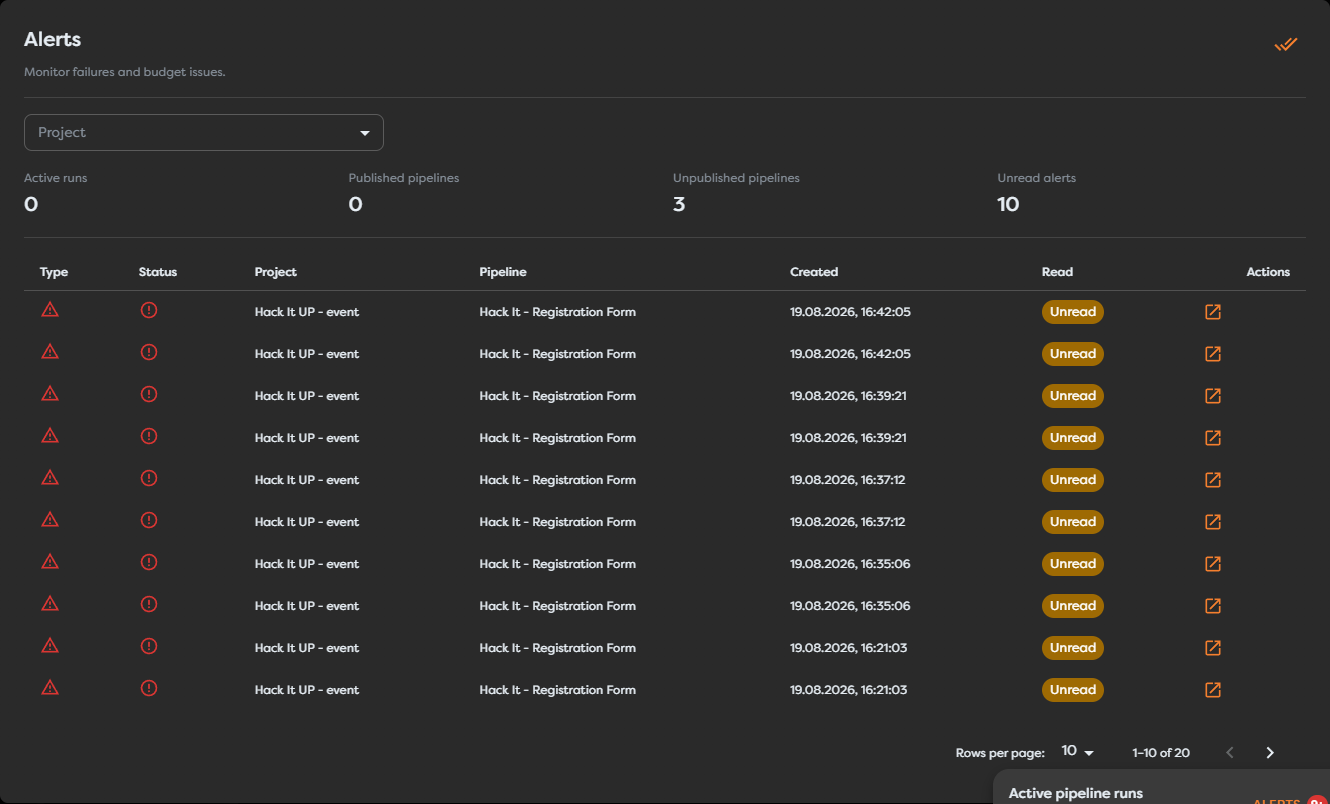
Each row contains:
| Field | What it shows |
|---|---|
| Type | The alert category, represented by an icon. A workflow failure is exposed as pipeline_failed. |
| Status | The reported outcome, such as fail. |
| Project | The project that owns the affected workflow. |
| Pipeline | The pipeline associated with the alert. |
| Created | The browser-localized date and time at which the alert was created. |
| Read | Whether the alert is still Unread or has been marked Read. |
| Actions | Opens the operational context stored with the alert. |
Use Rows per page and the previous or next controls to move through longer alert histories. Changing the project filter narrows both the table and the operational counters above it.
Open an alert and inspect the run
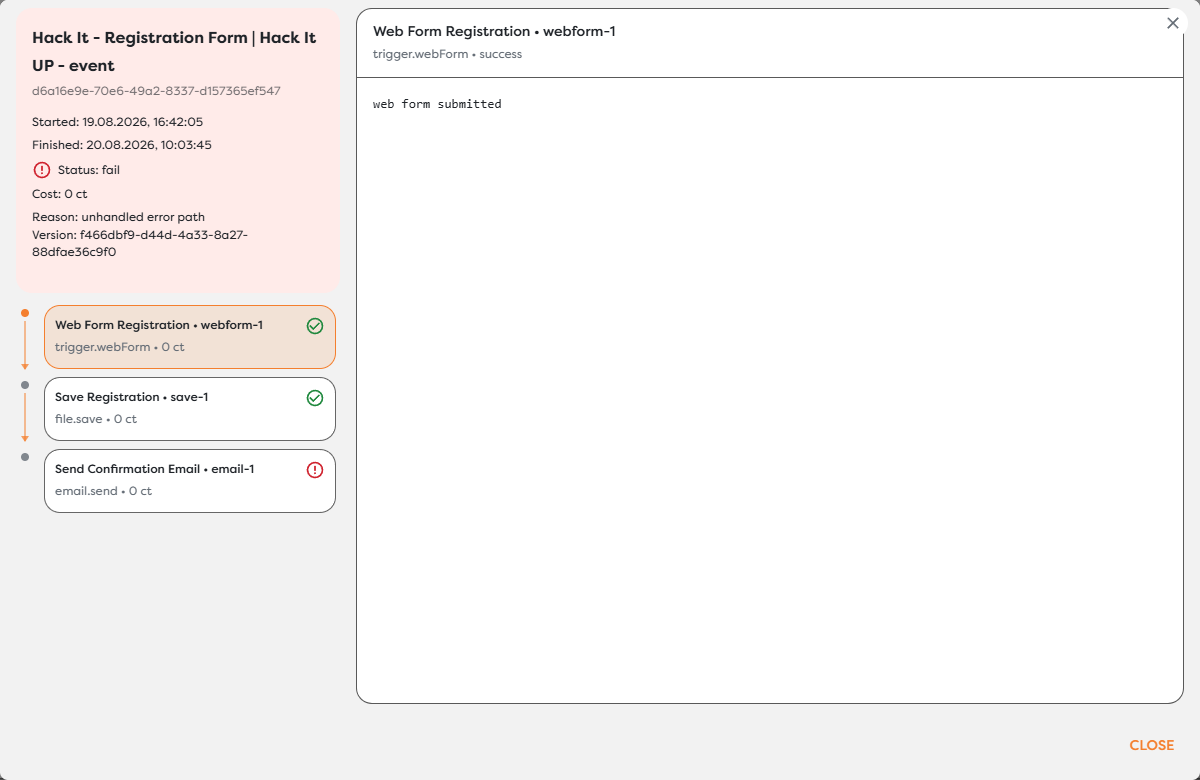
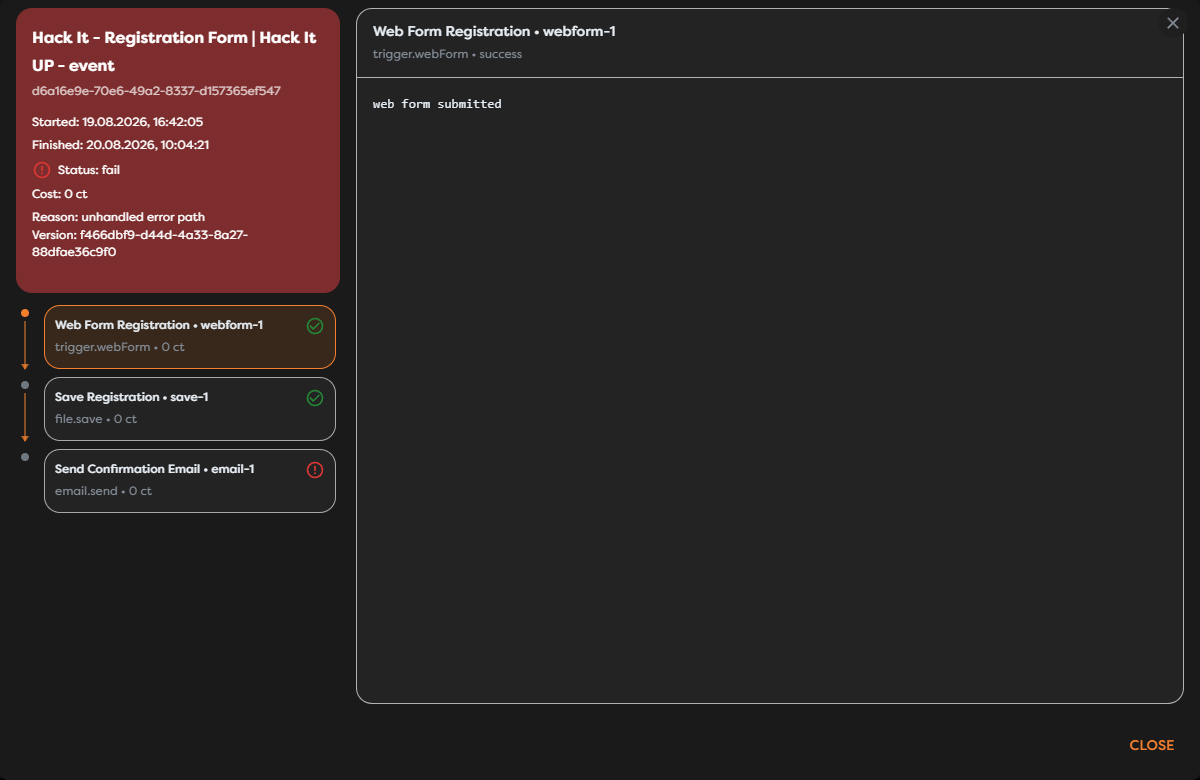
Select Open in an alert row. A run alert opens the run inspector and changes that alert to Read. The inspector shows the run ID, project, pipeline, start and finish times, status, cost, failure reason, workflow version ID, and reached block executions.
Investigate in this order:
- Match the run ID, project, and pipeline to the incident you are reviewing.
- Read the run-level status and reason.
- Find the first failed or incomplete block in the execution path.
- Select that block and inspect its runtime messages.
- Confirm the external result before retrying the run.
The available destination depends on the context recorded with the alert. Dashboard cards can link directly to a blocking node or its pipeline. An alert-list entry for a failed run opens the run inspector instead.
Mark alerts as read
Opening an alert marks that individual entry as read. To clear the whole unread queue, use Mark all as read in the Alerts page header. The action is disabled when the unread count reaches zero.
Read state is an acknowledgement, not a workflow-state change. Marking an alert as read does not repair, retry, cancel, publish, or unpublish the affected pipeline. Keep the run ID or pipeline context until the underlying condition has been resolved.
Review recent user events on the dashboard
Switch the dashboard activity panel from Alerts to Events to review recent user actions. This preview includes activity such as publishing or unpublishing a pipeline, creating or editing a project, configuring an integration, and changing a General Vault entry.
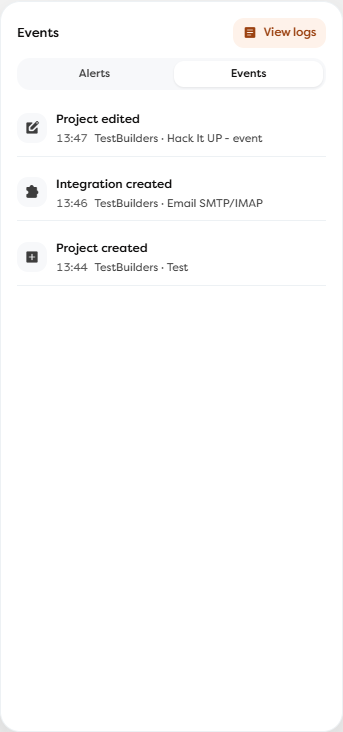
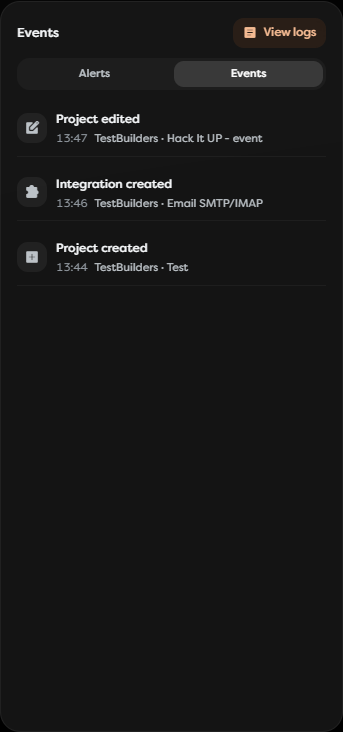
An event identifies the action, time, actor, and affected resource. Select View logs to open the complete user activity log.
Browse the user activity log
The User activity logs page retains project, pipeline, integration, and Vault changes from the last 30 days. Use the refresh action to request the newest entries and the pagination control to change how many rows are visible.
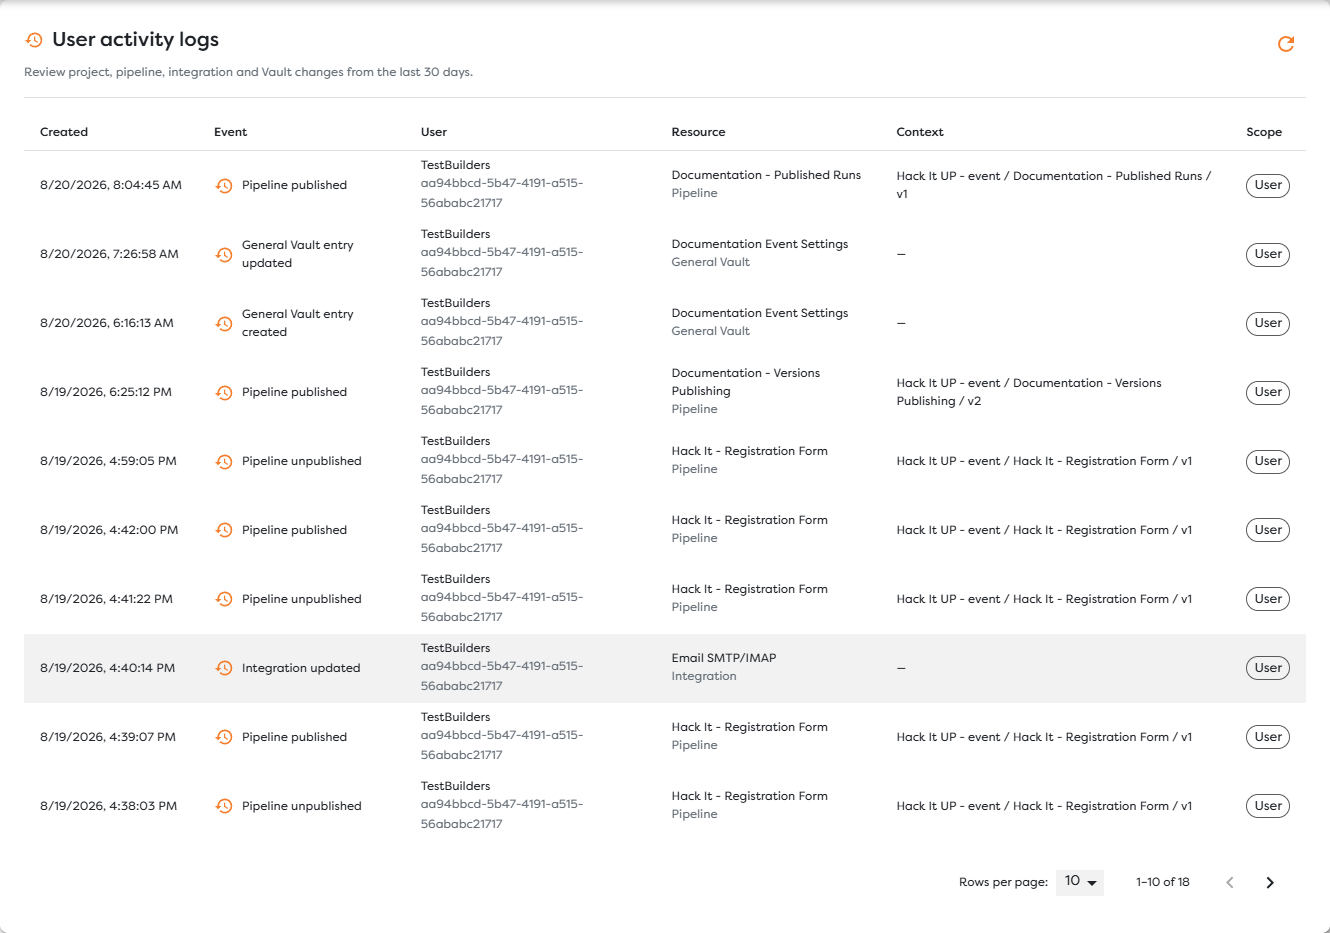
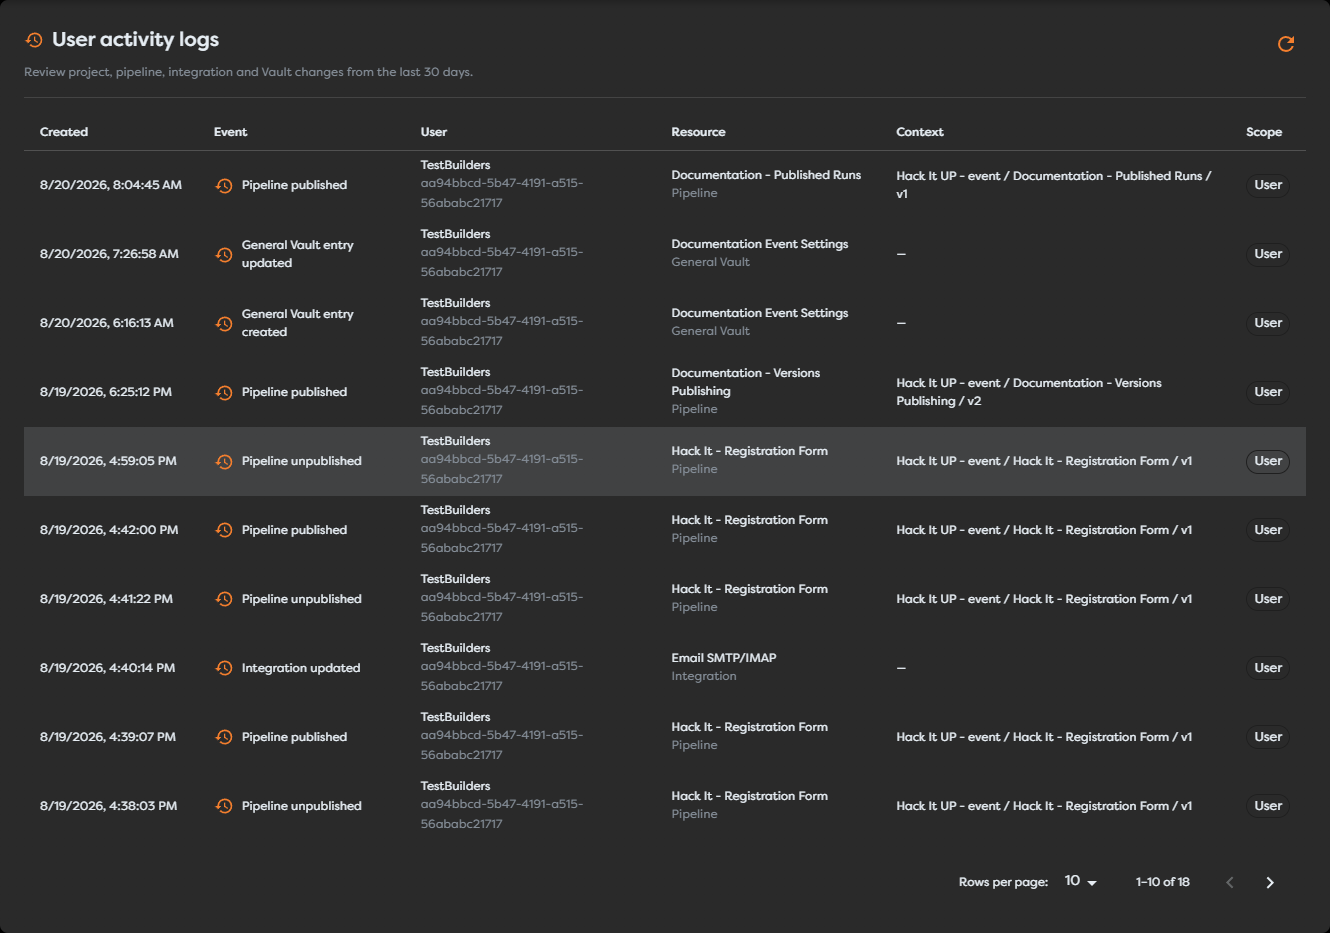
Read each row as an audit record:
| Field | Meaning |
|---|---|
| Created | The event time formatted for the current browser locale. |
| Event | The action that was recorded, such as Pipeline published or Integration updated. |
| User | The displayed actor name and the actor's identifier. |
| Resource | The affected resource name and type. |
| Context | The owning project, pipeline, and version path when applicable. |
| Scope | Whether the action belongs to the current user or another supported ownership scope. |
The dashboard tabs act as a first-level filter between operational alerts and user events. The Alerts page adds a project filter, while the full user activity log provides refresh and pagination controls. Do not expect the user-event log to contain block runtime messages; those belong to the run inspector.
Interpret dates and retention
Builders formats alert and event timestamps using the browser's locale and time-zone settings. The same event can therefore appear as 19.08.2026, 16:42 in one browser and 8/19/2026, 4:42 PM in another.
When correlating activity across users or external systems:
- Confirm the browser time zone.
- Use the run ID, resource ID, or version ID as the primary identifier.
- Treat the displayed timestamp as supporting context rather than a unique key.
- Export or record required audit information before it falls outside the 30-day user-event retention window.
The 30-day statement applies to user activity events. Run history and alert availability are separate product records and should not be used as a long-term compliance archive without an explicit retention policy.
Troubleshoot alerts and events
- The bell count did not change: allow the live update to arrive, then reopen the notification popover or the Alerts page.
- An alert disappeared from the unread queue: check the complete alert list. Opening it or using Mark all as read changes its read state but does not delete the row.
- Open node is unavailable: open the pipeline or run inspector instead. Direct node navigation requires node context in the alert.
- The timestamp differs from another user's view: compare browser locale and time-zone settings, then correlate by ID.
- A recent change is missing from Logs: use Refresh logs, verify that the action is a supported user event, and check that it occurred within the last 30 days.
- The event does not explain a runtime failure: open Runs or the corresponding alert and inspect the block execution messages.